Customer Segmentation for Marketing Optimization
Project information
- Category: Analysis
- Project date: Feb, 2024
- Key Features: Segmentation, Prediction, Patterns, Categorization and Accuracy
- Technologies Used: Python, Scikit-learn, Pandas, NumPy, Seaborn, NLTK, PCA, SVM, KNN, Random Forest, AdaBoost
- Dataset: E-commerce customer transactions dataset, featuring product descriptions, order quantities, customer IDs, and transaction timestamps.
- Project URL: Github link
This project uses machine learning to segment customers and predict future purchases from an e-commerce dataset, providing valuable insights for targeted marketing strategies and improved customer retention.
Customer Segmentation Using Machine Learning: A Comprehensive Guide
In today’s competitive market, understanding customer behavior is crucial for businesses to tailor their marketing strategies, enhance customer retention, and optimize sales. Customer segmentation, powered by machine learning, offers a data-driven approach to grouping customers based on their purchasing patterns and predicting future behaviors. This project, entirely developed by me, focuses on creating customer segments and predicting future purchases based on their first transaction. In this blog, I’ll cover the why, what, how, and key insights of this project, while also providing important code snippets alongside the methodology.
Purpose of Customer Segmentation
Customer segmentation allows businesses to:
- Deliver personalized customer experiences.
- Predict future buying behaviors.
- Allocate resources efficiently by focusing on high-value segments.
This project aims to group customers based on their purchase history and predict their future behaviors, enabling businesses to optimize marketing strategies and customer engagement.
Project Overview
The project involved the following key steps:
- Data Cleaning and Preparation: Handling missing values and duplicates.
- Exploratory Data Analysis (EDA): Understanding customer behaviors and product trends.
- Clustering: Segmenting customers into different groups using K-Means.
- Classification: Building predictive models to classify customers based on their first purchase.
- Evaluation: Assessing models with the Silhouette Score and learning curves.
Execution of the Project:
Data Cleaning and Preparation
The dataset consisted of e-commerce transactions. To ensure high-quality analysis, I first handled missing and duplicate values. For example, rows with missing customer IDs (about 25%) were removed, as they didn’t contribute useful information.
df_initial.dropna(axis=0, subset=['CustomerID'], inplace=True)
print('Dataframe dimensions:', df_initial.shape)
This cleaned the dataset, reducing it to relevant customer data for further analysis.
Exploratory Data Analysis (EDA)
In this phase, I analyzed key attributes like CustomerID, InvoiceNo, and Country to gain insights into customer behavior. Some patterns discovered included:
- One-time Buyers: A significant portion of customers (33%) made only one purchase.
- Frequent Buyers: Small but consistent transactions from repeat customers.
Additionally, a 16% order cancellation rate was noted, which indicated a potential issue with customer satisfaction.
# Count of unique customers, products, and transactions
pd.DataFrame([{'customers': len(df_initial['CustomerID'].value_counts()),
              'products': len(df_initial['StockCode'].value_counts()),
              'transactions': len(df_initial['InvoiceNo'].value_counts())}])
Clustering
I employed K-Means clustering to group customers into segments based on their purchasing behavior. The optimal number of clusters was determined using the Silhouette Score, and five clusters were identified, each representing a unique customer behavior.
from sklearn.cluster import KMeans
from sklearn.metrics import silhouette_score
 # Perform K-Means clustering
kmeans = KMeans(n_clusters=5, init='k-means++', n_init=30)
clusters = kmeans.fit_predict(matrix)
# Calculate the Silhouette Score
silhouette_avg = silhouette_score(matrix, clusters)
print(f"Silhouette Score: {silhouette_avg}")
The five identified customer clusters are as follows:
- Cluster 1: Luxury shoppers – infrequent but high-value purchases.
- Cluster 2: Seasonal buyers – purchases aligned with holidays/events.
- Cluster 3: Frequent small buyers – regular, smaller purchases.
- Cluster 4: One-time buyers – single purchase and no return.
- Cluster 5: Bulk buyers – large orders but infrequent shopping.
Product Categorization
Next, I grouped products based on their descriptions using Natural Language Processing (NLP). By applying a word frequency analysis, I identified key product categories like luxury items and holiday gifts, which aligned with specific customer segments.
from nltk.tokenize import word_tokenize
from collections import Counter
# Tokenize product descriptions
words = word_tokenize(' '.join(df_initial['Description'].dropna()))
word_freq = Counter(words) 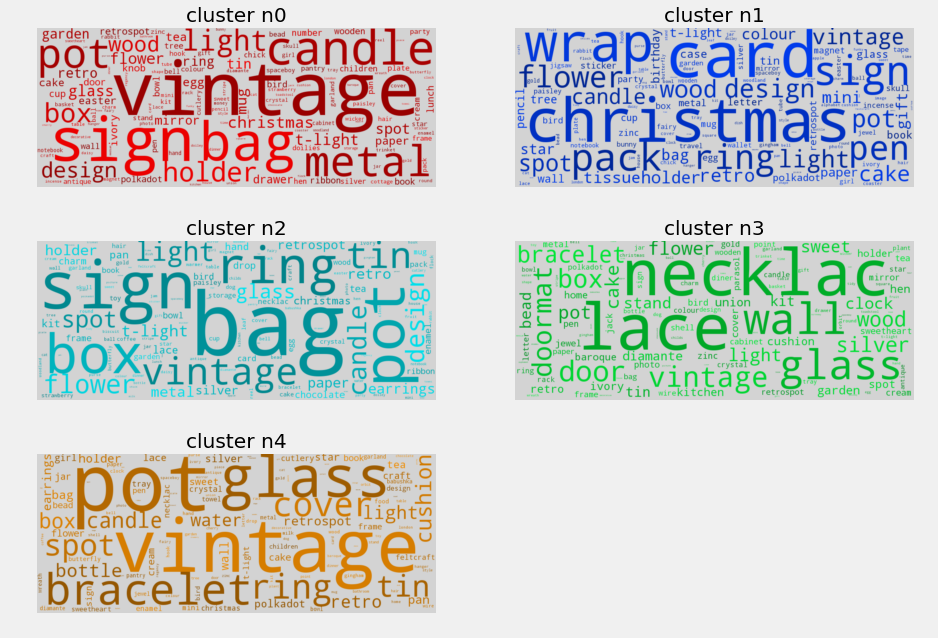
This allowed me to further refine customer segments based on their preferred product types.
Principal Component Analysis (PCA)
I applied PCA to reduce the dimensions of the dataset, making it easier to visualize clusters and highlight the relationships between customer segments. PCA helped confirm that the five clusters were well separated and unique.
from sklearn.decomposition import PCA
# Apply PCA for dimensionality reduction
pca = PCA(n_components=2)
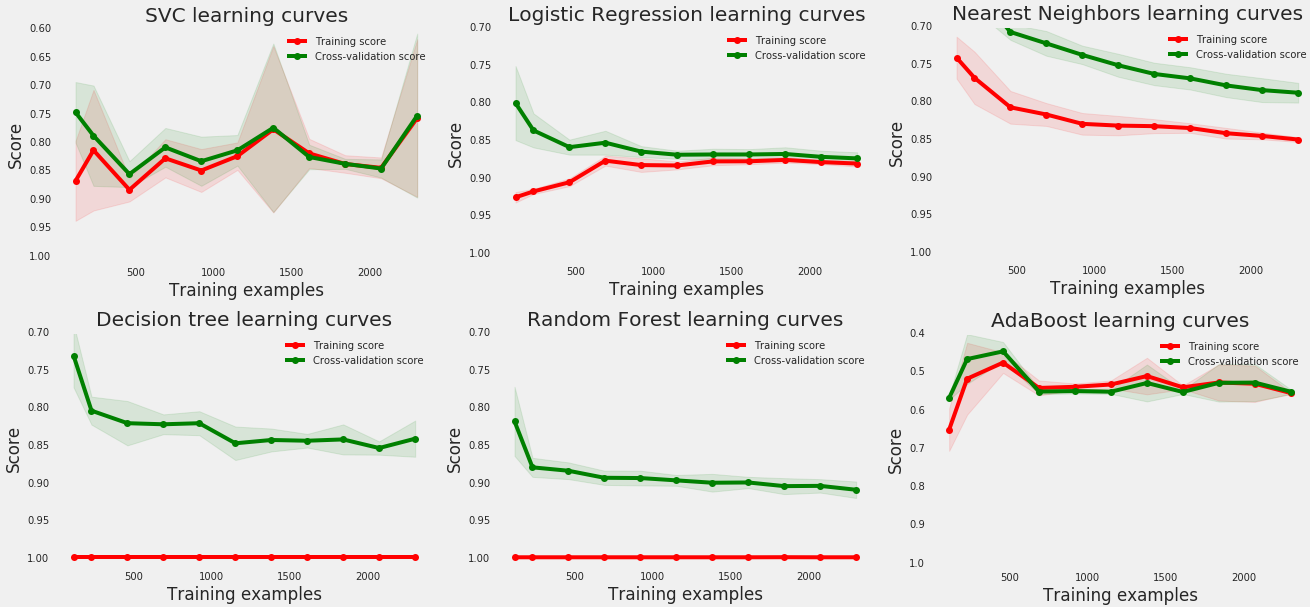
pca_result = pca.fit_transform(matrix)Classification and Prediction
I used multiple machine learning models to predict future customer behavior based on their first purchase. The models included:
- Support Vector Machine (SVM)
- Logistic Regression
- K-Nearest Neighbors (KNN)
- Decision Trees
- Random Forest
- AdaBoost Classifier
The Voting Classifier combining Random Forest, Gradient Boosting, and KNN performed the best, achieving over 85% accuracy in predicting future customer behavior.
from sklearn.ensemble import VotingClassifier

# Combine models in a Voting Classifier
votingC = VotingClassifier(estimators=[('rf', rf_best), ('gb', gb_best), ('knn', knn_best)], voting='soft')
votingC.fit(X_train, Y_train)