A/B Testing with Cookies Game
Project information
- Category: Analysis
- Project date: May, 2024
- Analysis Process: Data Exploration, Retention Metrics, Hypothesis Testing
- Technologies Used: Python, Pandas, SciPy, Matplotlib and A/B Testing
- Dataset: This dataset only covers the UK Region Link
- Project URL: Github link
This project focuses on A/B testing in the popular mobile game Cookie Cats. The primary goal is to evaluate the impact of altering the level progression flow on player retention. The game introduced an in-game gate that blocks progress after a certain number of levels, and we analyze two groups: one where the gate appears early and another where it appears later.
Player Retention in Cookie Cats: A Data-Driven Approach
1. Introduction to the Problem
Player retention is key to the success of mobile games. Developers constantly experiment with game mechanics to find the right balance between engagement and monetization. In Cookie Cats, a popular puzzle game, a key mechanic is the placement of gates—obstacles that players must pass through, either by waiting or making in-app purchases.
This blog explores an A/B test conducted to analyze whether moving the first gate from level 30 to level 40 would improve player retention. The central question: Where should the gate be placed to maximize retention?
2. Experiment Setup
The dataset consists of information from 90,189 players who were randomly assigned to two groups:
- Gate at level 30: The control group.
- Gate at level 40: The experimental group.
The dataset captures several important variables:
- 1-day retention: Whether the player returned to play 1 day after installing the game.
- 7-day retention: Whether the player returned 7 days after installing the game.
- Game rounds: The number of rounds played in the first 14 days.
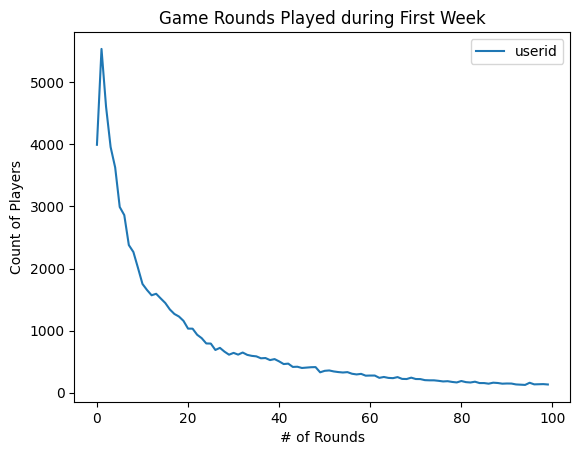
Our goal is to analyze how gate placement affects both 1-day and 7-day retention.
3. Analyzing 1-Day Retention
1-day retention is an early indicator of whether players are finding the game engaging enough to come back after the first day. Higher retention on day one can lead to longer-term engagement.
Let’s calculate the 1-day retention rates for both groups:
# Calculating 1-day retention for each group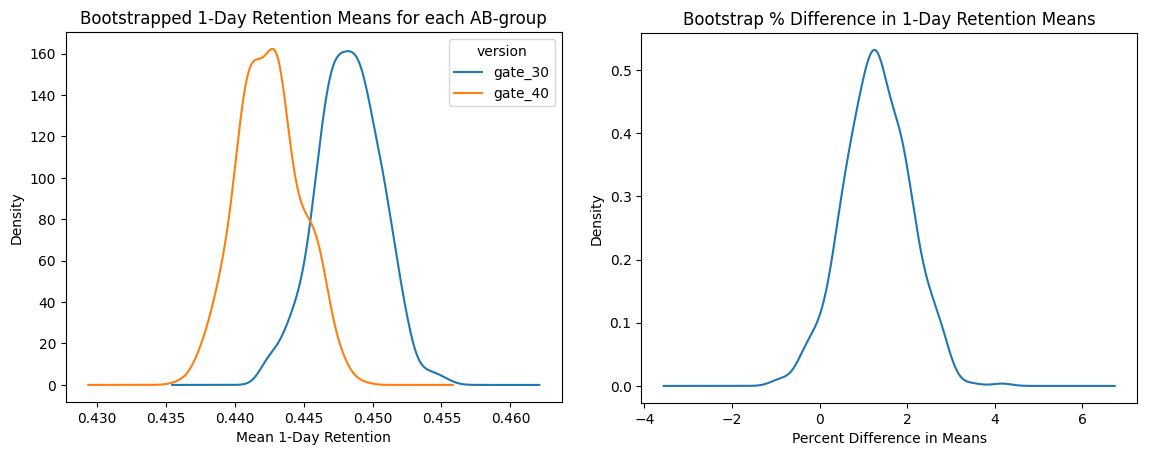
df.groupby('version')['retention_1'].mean()- Gate at level 30: 44.8% of players returned after 1 day.
- Gate at level 40: 44.2% of players returned after 1 day.
While the difference is small, it shows that slightly more players return when the gate is placed at level 30. Small improvements in retention can lead to larger gains in long-term player engagement.
4. Analyzing 7-Day Retention
4. Analyzing 7-Day Retention
7-day retention measures long-term engagement. It indicates how many players continue playing a week after installation, offering a deeper look at whether gate placement has a lasting effect on player behavior.
# Calculating 7-day retention for each group
df.groupby('version')['retention_7'].mean()
- Gate at level 30: 19.0% of players returned after 7 days.
- Gate at level 40: 18.2% of players returned after 7 days.
Here, the gate at level 30 outperforms gate 40 by a more significant margin than in the 1-day retention. This suggests that introducing the gate earlier keeps more players engaged over the long term.
5. Bootstrapping for Certainty
While the differences in retention between the two groups are clear, we need to ensure that these differences are statistically significant. To achieve this, we use bootstrapping—a resampling method that helps measure the uncertainty of the retention rates.
Bootstrapping 1-Day and 7-Day Retention:
# Bootstrapping 1-day and 7-day retention
boot_1d = []
boot_7d = []
for i in range(500):
        boot_mean_1d = df.sample(frac=1, replace=True).groupby('version')['retention_1'].mean()
        boot_mean_7d = df.sample(frac=1, replace=True).groupby('version')['retention_7'].mean()
        boot_1d.append(boot_mean_1d)
        boot_7d.append(boot_mean_7d)